

Crime Against Women In India- A Data Analysis Project


The country where we worship goddess is also the worst country for women. Crime against women reported every two minutes over the last decade.
It is 2021. We survived one of the worst years, and hopefully, everything will be back to normal. But one thing which hasn't changed yet was the number of crimes against women.
You might be thinking last year everybody was at home, why didn't the crime case reduced. Well, domestic violence complaints at a 10-year high during COVID-19 lockdown. You can read it in the article by The Hindu here.
My main aim is here to show how crimes against women were increasing from 2001 to 2014.
You can find the code of this project at Jovian.ml or my GitHub profile.
Downloading the Dataset
Dataset is from Kaggle: View it here. This dataset contains statistics of various crimes cases against women from the year 2001-2014 with State or Union Territories.
The dataset contains the various crimes stats like Rape, Domestic Violence, Dowry, etc. with the year and place of the crime.
Cleaning the Dataset
There were many repeated rows. In some places, different letter cases were used for the same word as in Assam and ASSAM. Other places have improper spacing, and shorthands were used for the State/UT. Delhi was repeated with the suffix UT.
Some rows contain the total for that particular district which we don't want. So we are dropping all the columns which contain the word TOTAL.
After cleaning, this is how our final dataset will look like.
Analysing each crime by Year
We group all the rows in the dataset by years.
With this data frame, we were able to find the total number of cases which was more than 26 lakh and they were registered between 2001 and 2014.
With the help of plotly, an open-source interactive graphing library for charts to present each type of crime by years.
There had been an increase of more than 56% in rape cases from 2001 to 2014.
Although the literacy rate of India is increased by more than 75%, there is not much change in dowry cases.
Assault on modesty had a spike of more than 60%.
Percentage of each crime in between 2001-2014 through line graph and piechart
Which was the highest reported crime and which one was the least?
Cruelty by Husband or his Relatives was the highest reported crime with more than 11 lakh cases. So, stop forcing your girl to marry a stranger. They might have to face the worst people in their life because of your recklessness.
Analysing crimes by State/UT
Note: Merging TELANGANA and ANDHRA PRADESH because Telangana was formed in 2014 before this, it was a part of Andhra Pradesh. So before 2014, we don't have any data on Telangana.
We are also analysing the data based on State/UT. So, we can find out which State/UT is the worst to live in for women.
On grouping, the data is based on State/UT. The dataset is shown below.
Top 10 States/Union Territories With the Highest number of crime cases
Andhra Pradesh has the highest number of crime cases. Uttar Pradesh is the second highest.
Note: Without the merging of Andhra Pradesh and Telangana, Uttar Pradesh will be the state with the highest number of cases.
Top 10 States/Union Territories With the Lowest Crime Rate
Lakshadweep has the lowest crime rate.
Out of seven types of crime, which is the States/UT having maximum cases of each type?
Can we officially declare Madhya Pradesh as the worst state?🙄
Out of seven types of crime, which is the States/UT having minimum cases of each type?
Lakshadweep is the most secure UT for women.
ALL HAIL LAKSHADWEEP
Function For Specific State/UT Analysis
In the project file, I have defined a function which plots the pie chart for any specific State/UT mentioning all the crimes in that place. In the below output snippet, it shows the result for the Capital of India, New Delhi.
If you want to see the pie chart for another state, feel free to run my notebook.
Plotting Crimes on the map of India
I wanted to explore more on my project. So, I plot my data on choropleth maps from the Plotly library itself.
Here again, I have defined a function which shows a crime at a time on the map of India. To check the other crimes, run the cell again. Below is the output for the rape cases in India.
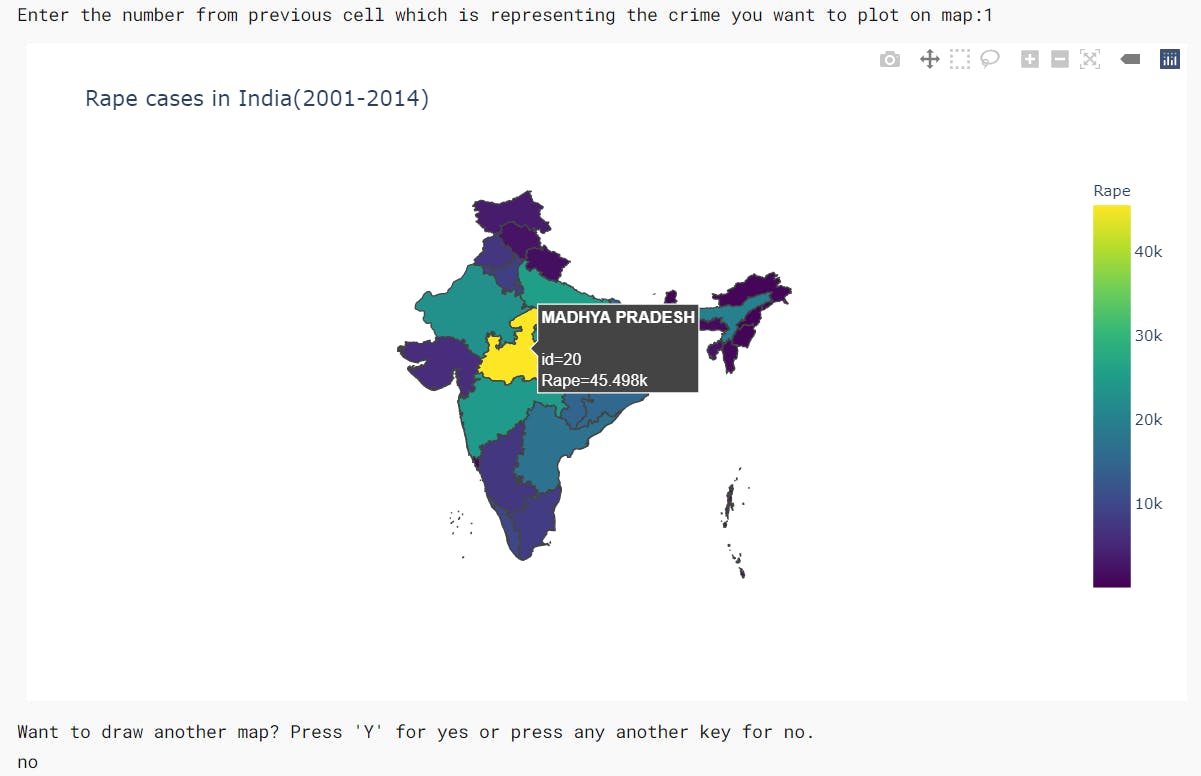
This map is also interactive, but to keep the blog light-weighted, I decided to go with the image. You can find the interactive map on my Jovian Notebook.
Inferences and Conclusion
India is one of the worst countries for women in the world. And in recent time it is getting worse when crimes against women are happening in the name of their religion. According to scroll.in, 26 crimes against women are reported every hour or one complaint every two minutes.
Andhra Pradesh had registered the most crimes against women from 2001 to 2014. Uttar Pradesh and West Bengal were second and third states with the most number of crimes against women. Andhra Pradesh also reported the highest number of cases of insult to the modesty of Women.
Madhya Pradesh reported the most number of Rape cases and Assault on her modest cases. Madhya Pradesh was also the fifth highest state with the most number of registered crime cases against women.
Uttar Pradesh reported the most number of Kidnapping and Abduction and Dowry Deaths. Seriously, still dowry!. The world is in the 21st century, but UP is still in the 18th century.
Madhya Pradesh, Andhra Pradesh, Uttar Pradesh, Rajasthan and West Bengal account for almost half of all crimes committed against women around the country from 2001 to 2014.
So, this county is not getting better, but we still have time to move forward in progress to make it safer, comfortable for all the women out there. Hopefully, we will achieve it soon.
If you have any suggestions or want anymore type of analysis from this dataset, please let me know.
Thank you.